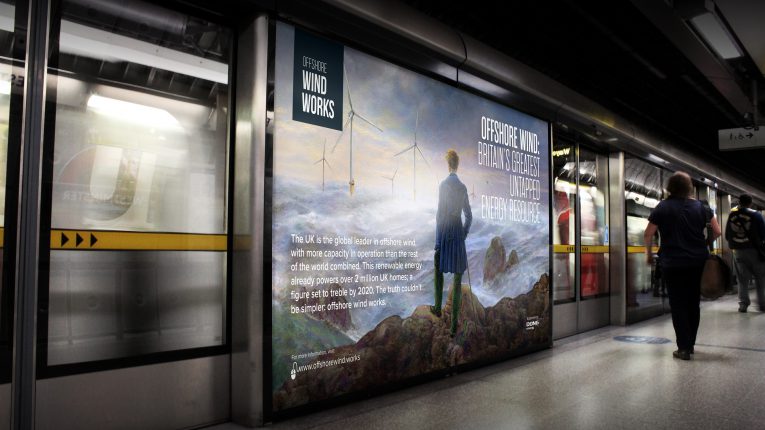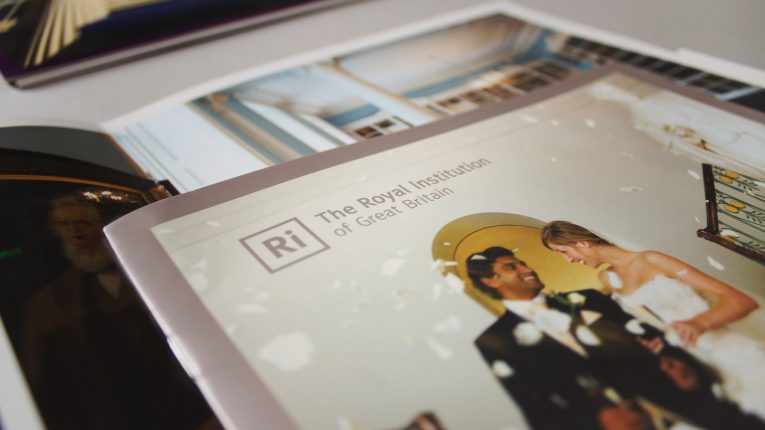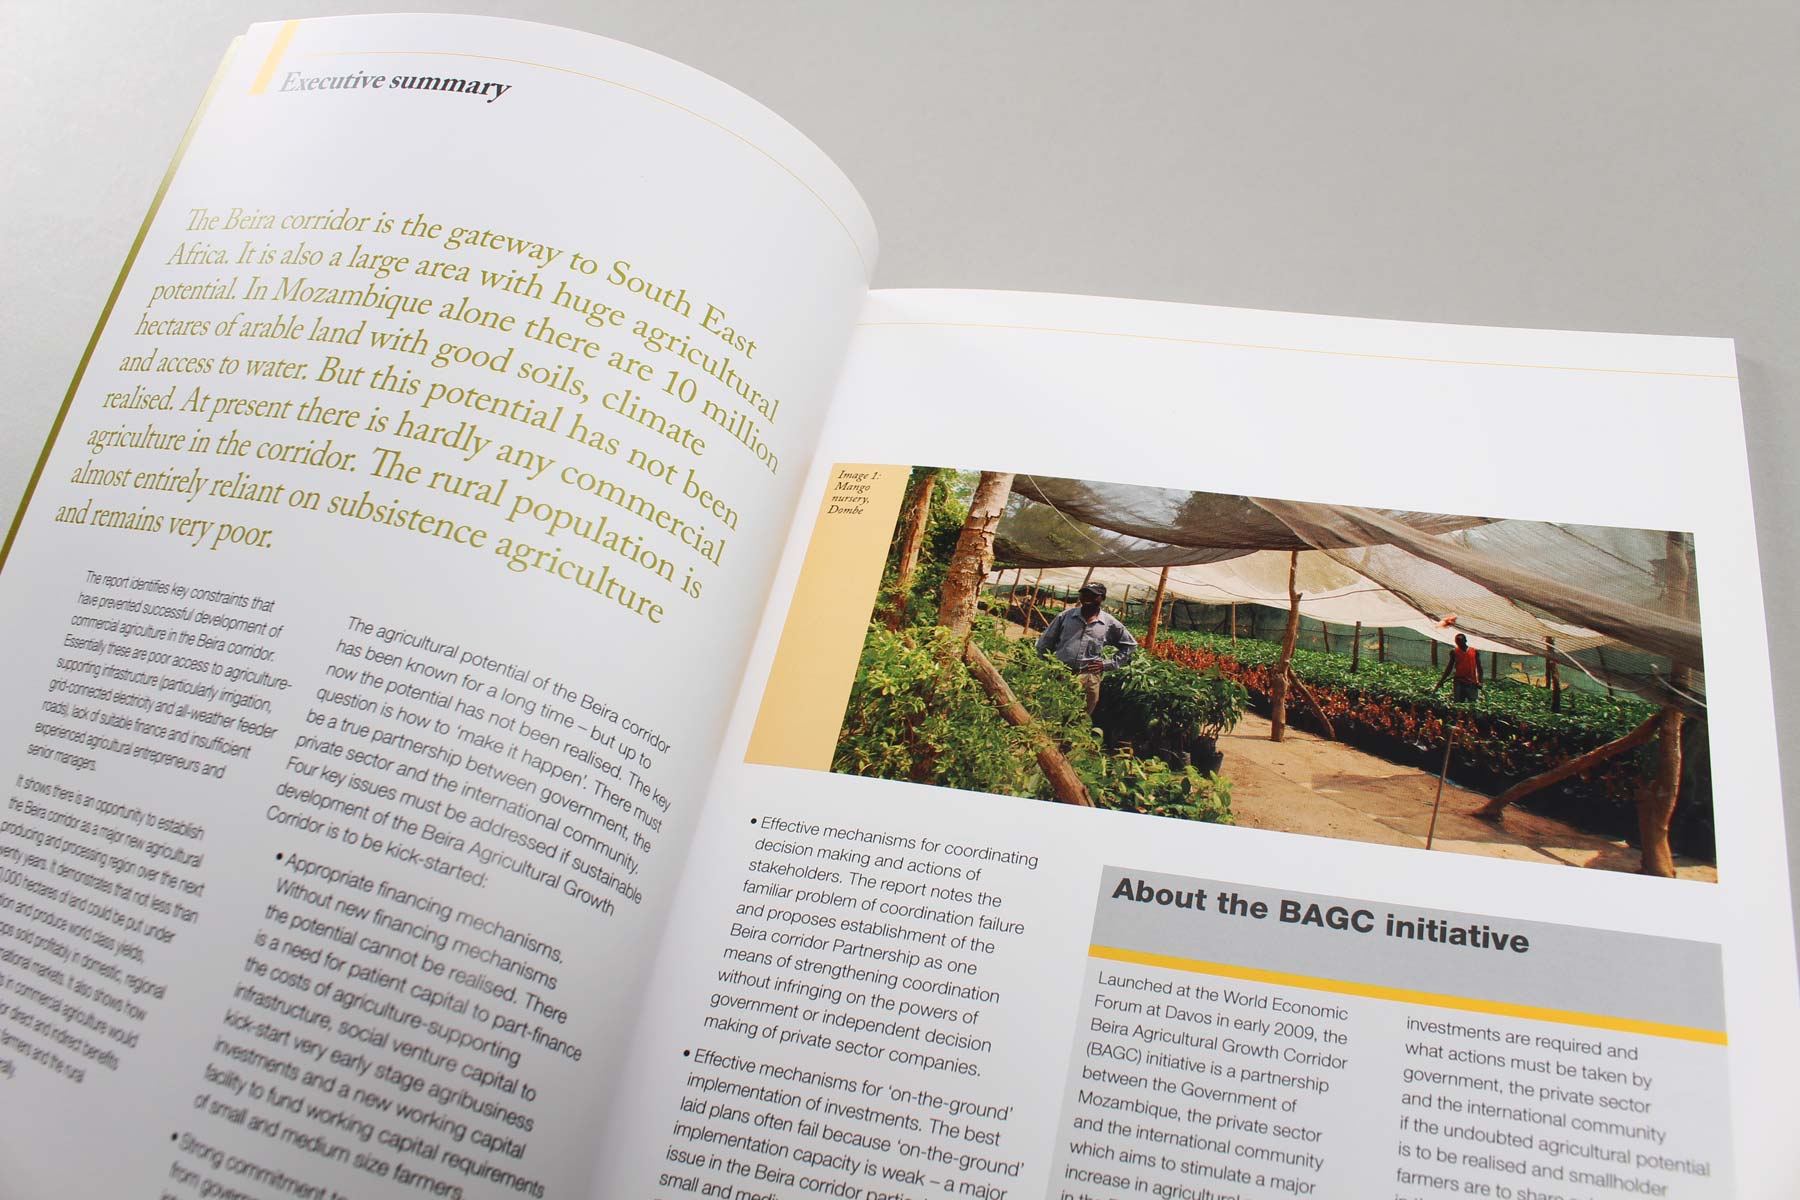
We selected a large amount of positive development imagery to underpin the narrative of the publication.
The work
Investment communications • publications • infographics
The brief
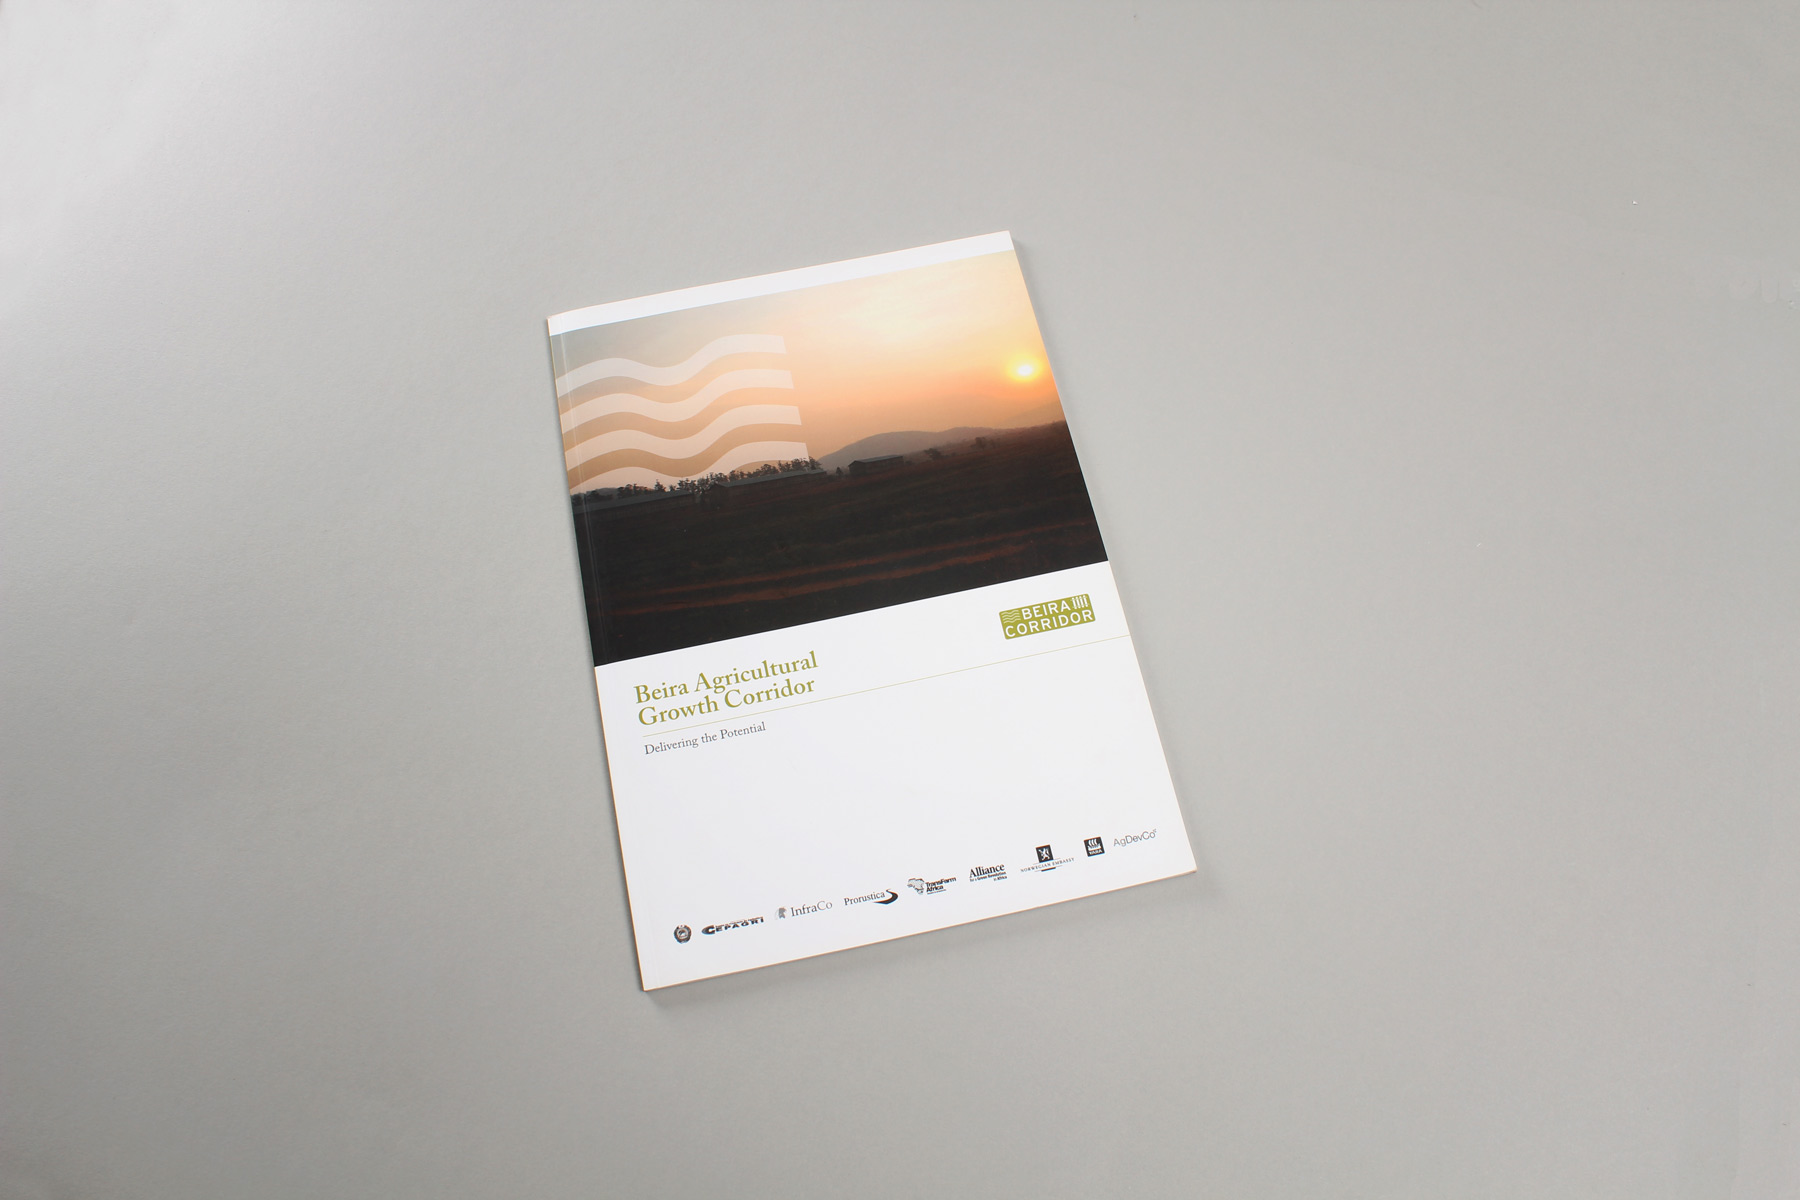
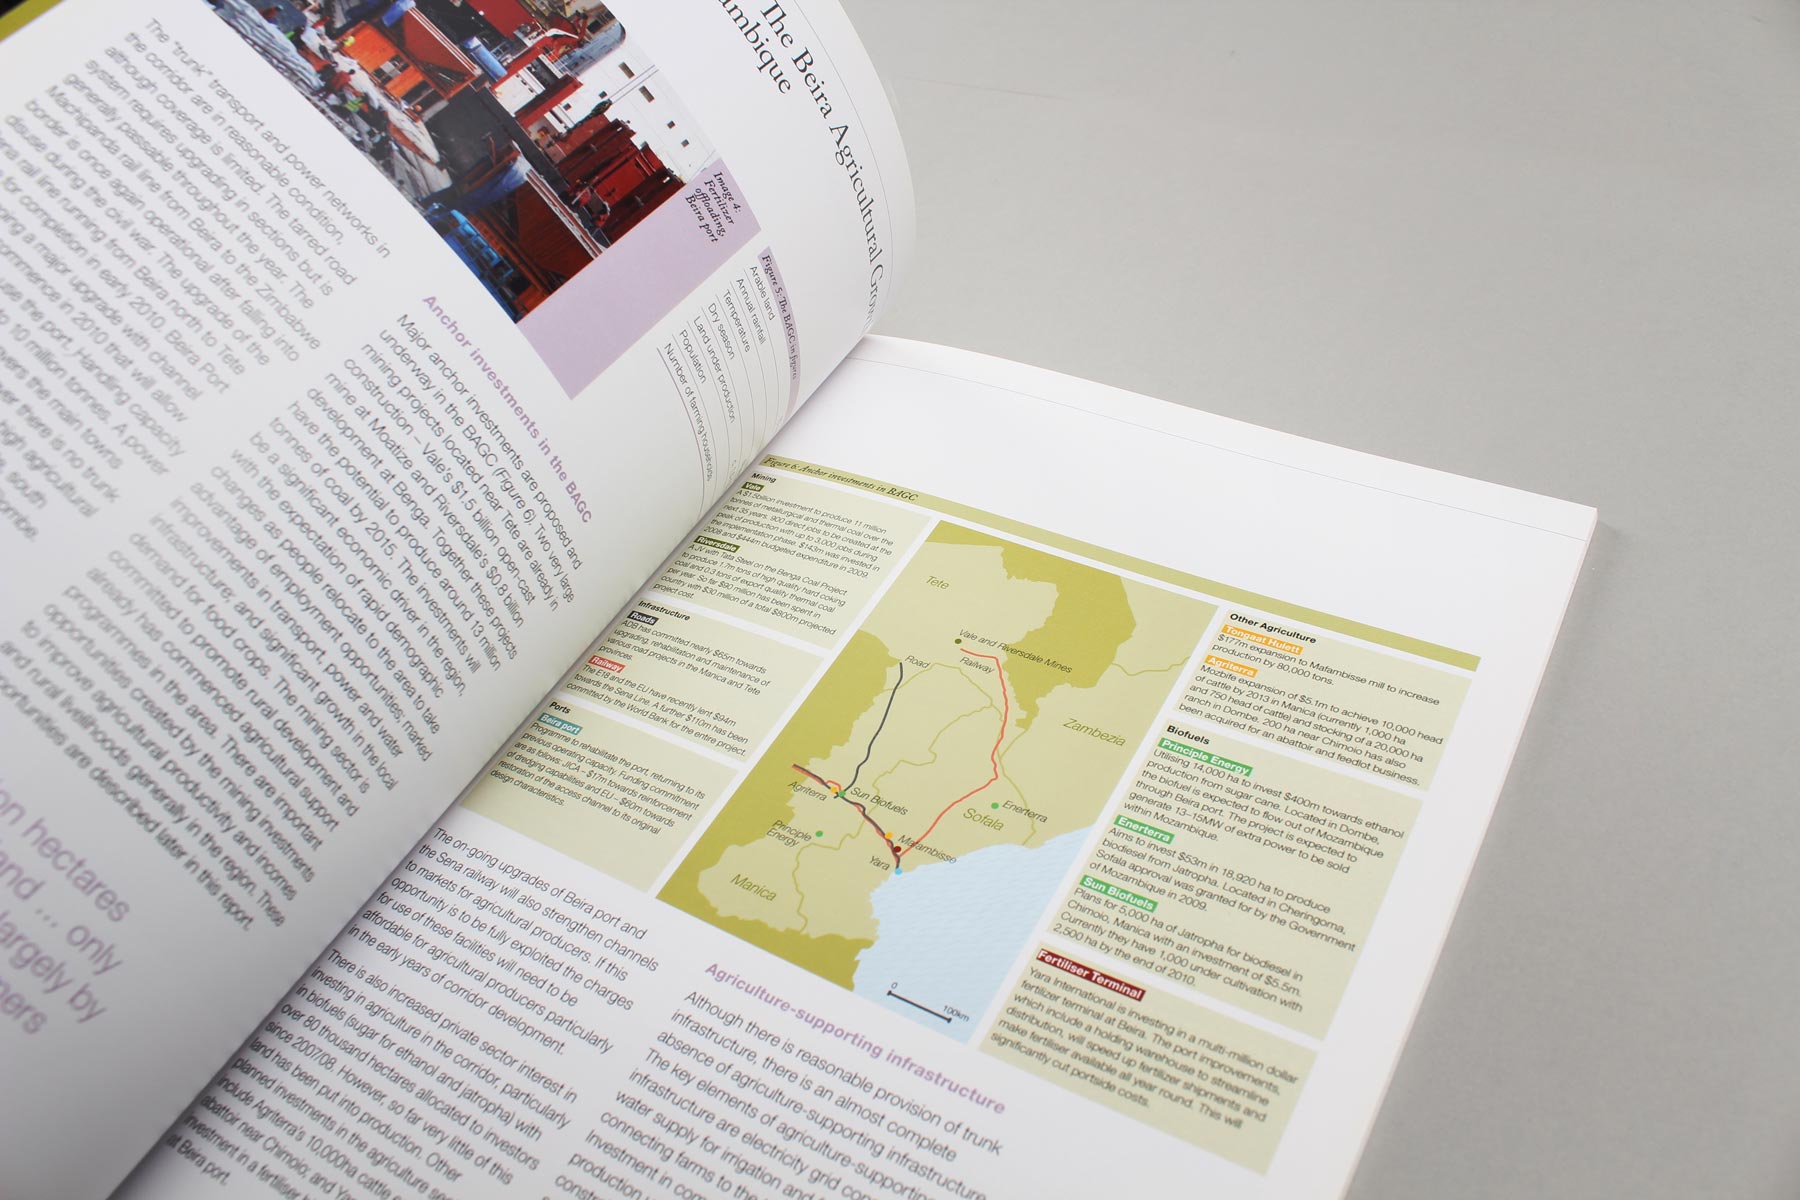
Firedog was tasked with preparing a 48 page report, ‘The Investment Blueprint’ that looked at the possibility for development of agricultural schemes in Biera, Mozambique. The report would be used to educate would-be private sponsors and institutions, such as the World Bank, of the latent potential of the area. The report was launched on Wednesday 27 January at the World Economic Forum in Davos.
The solution
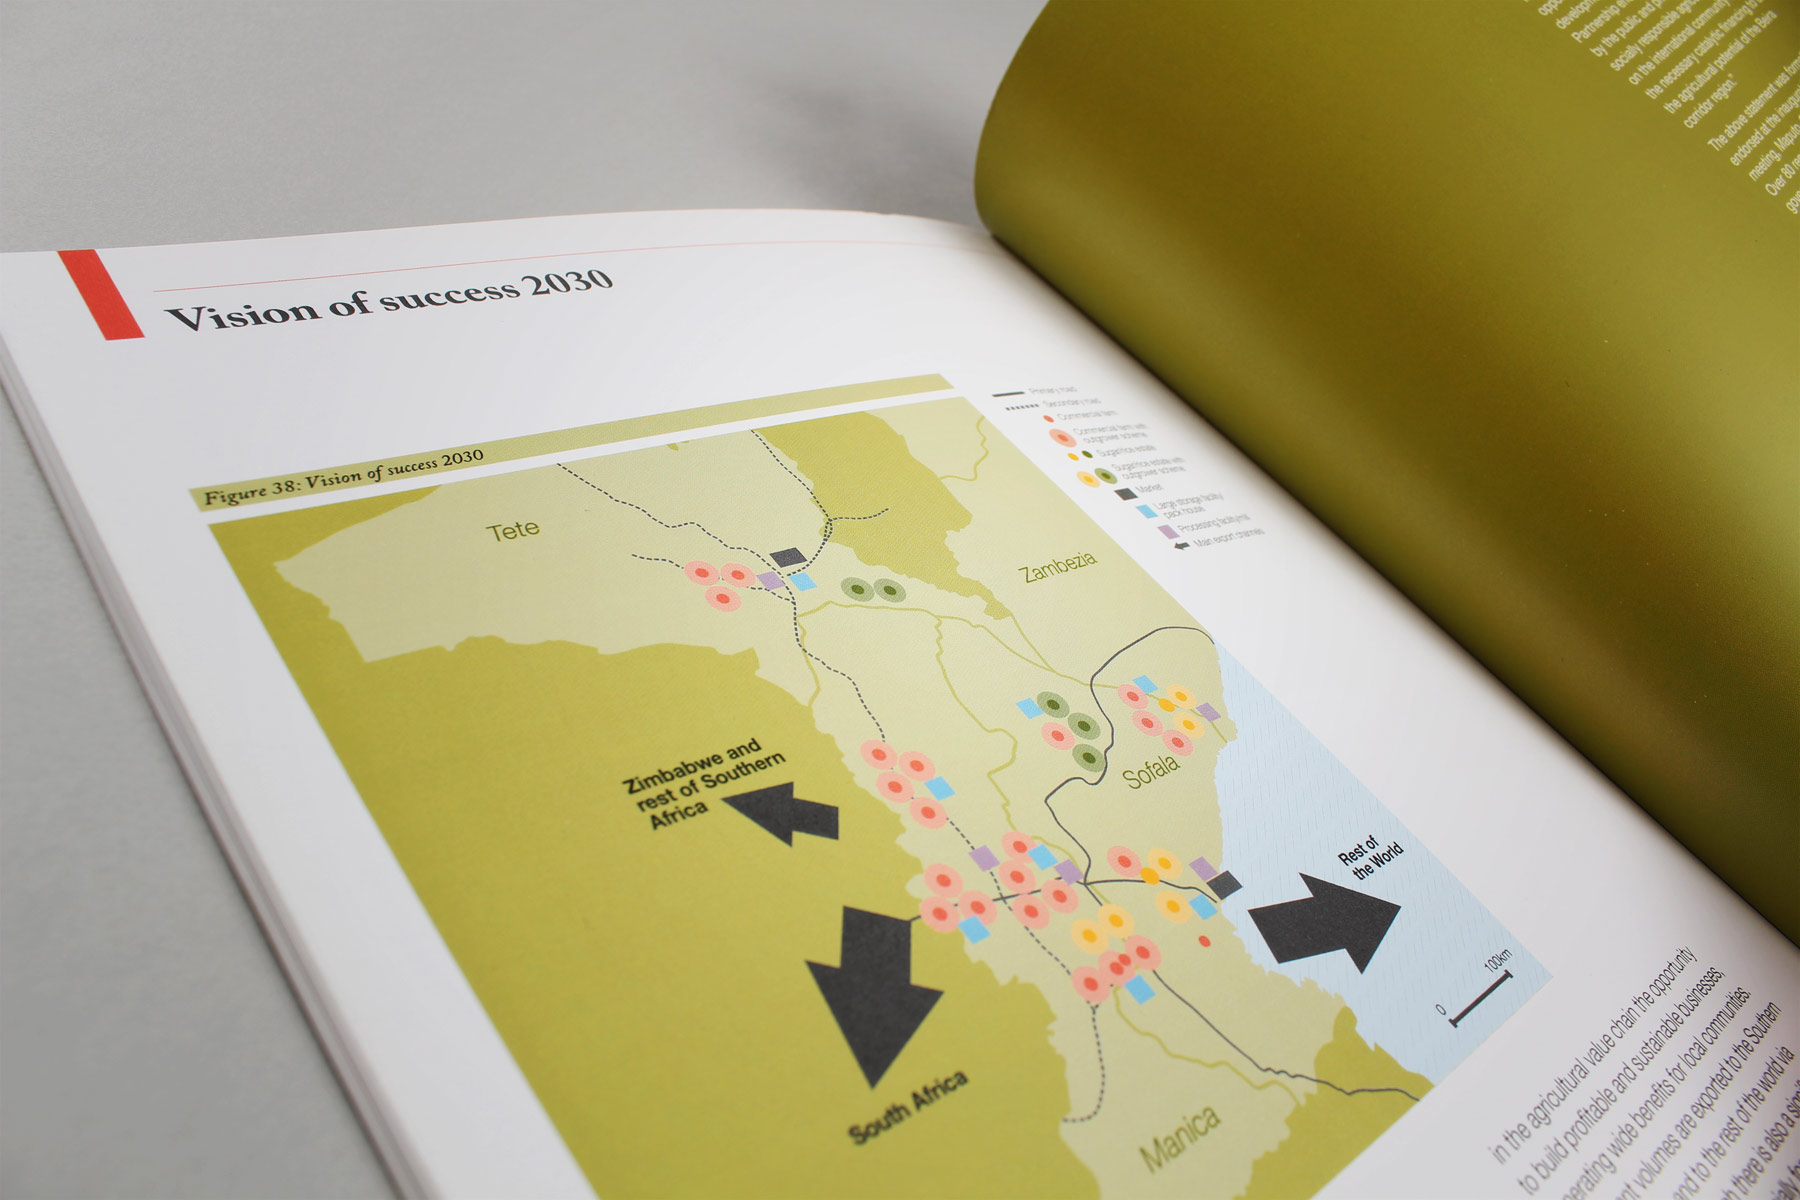
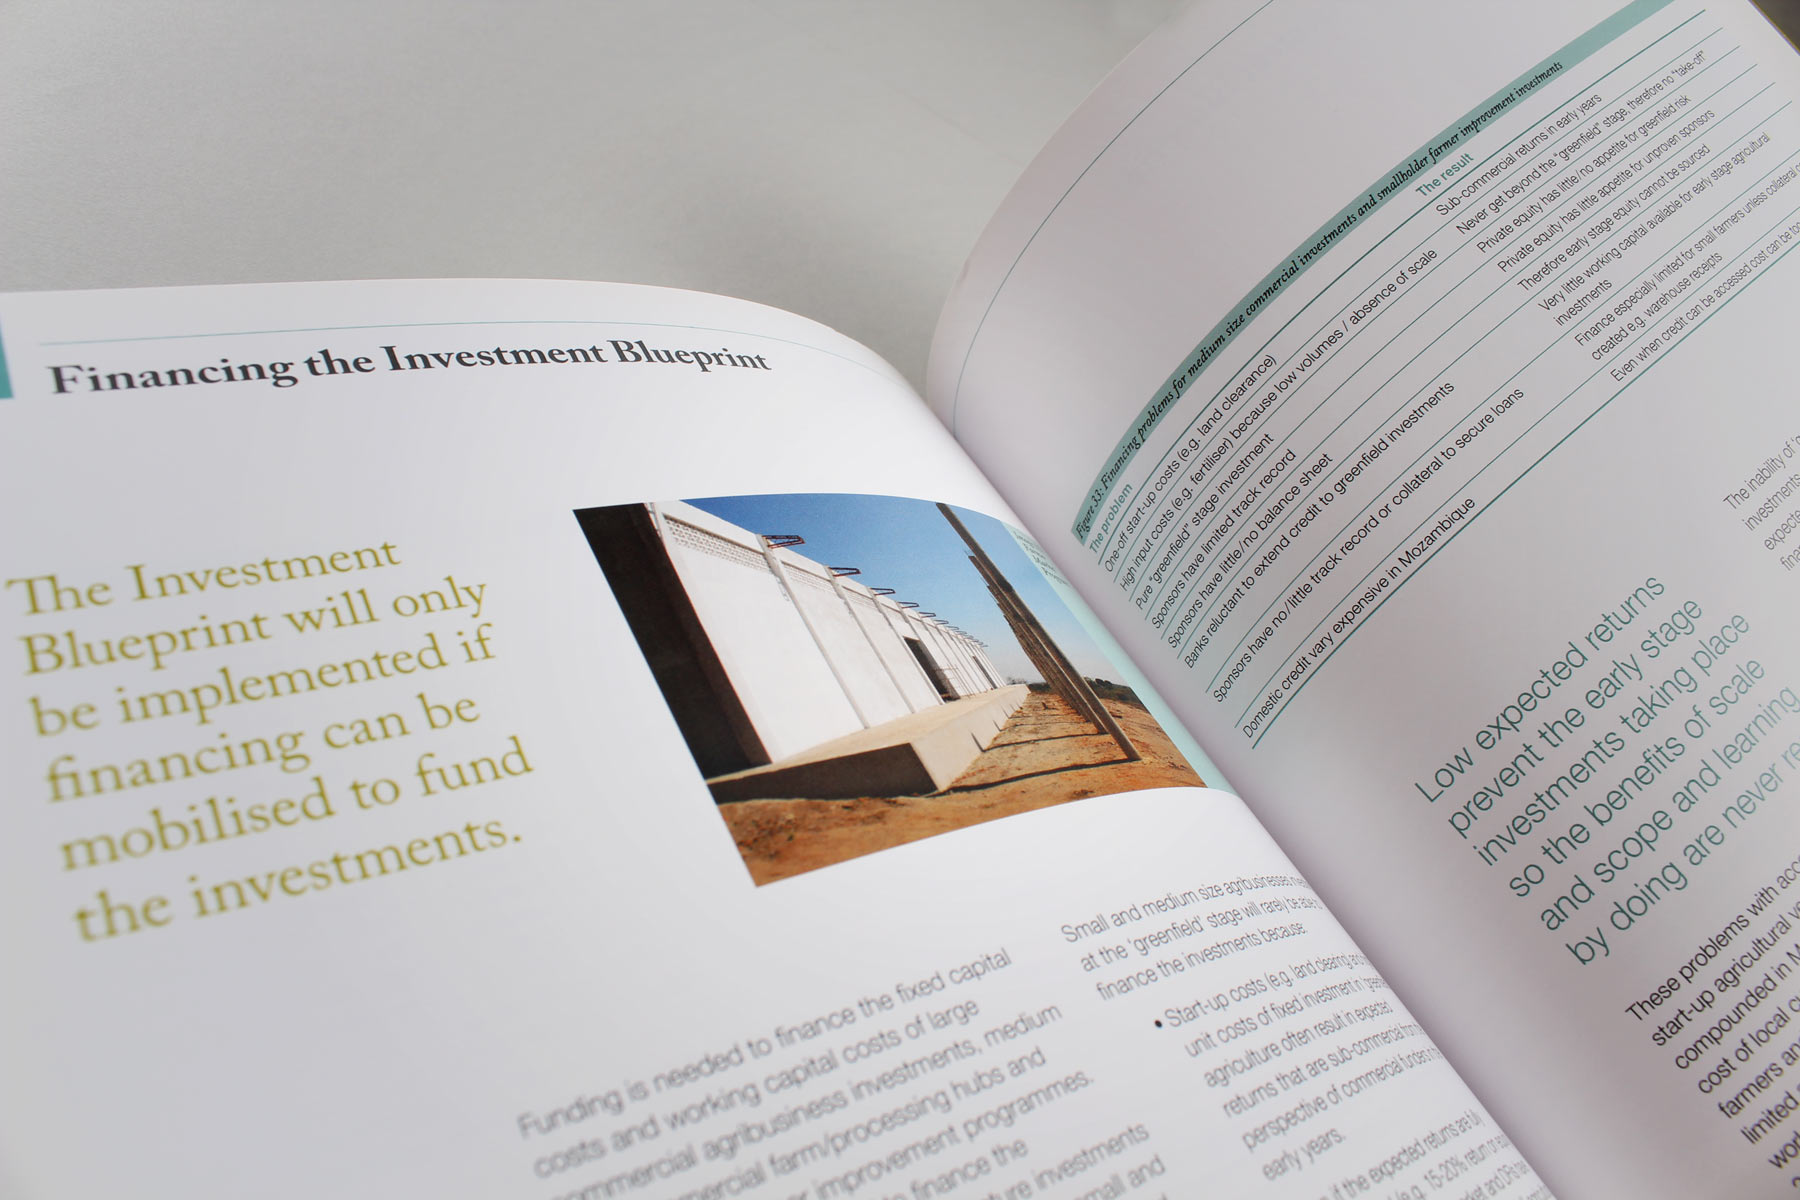
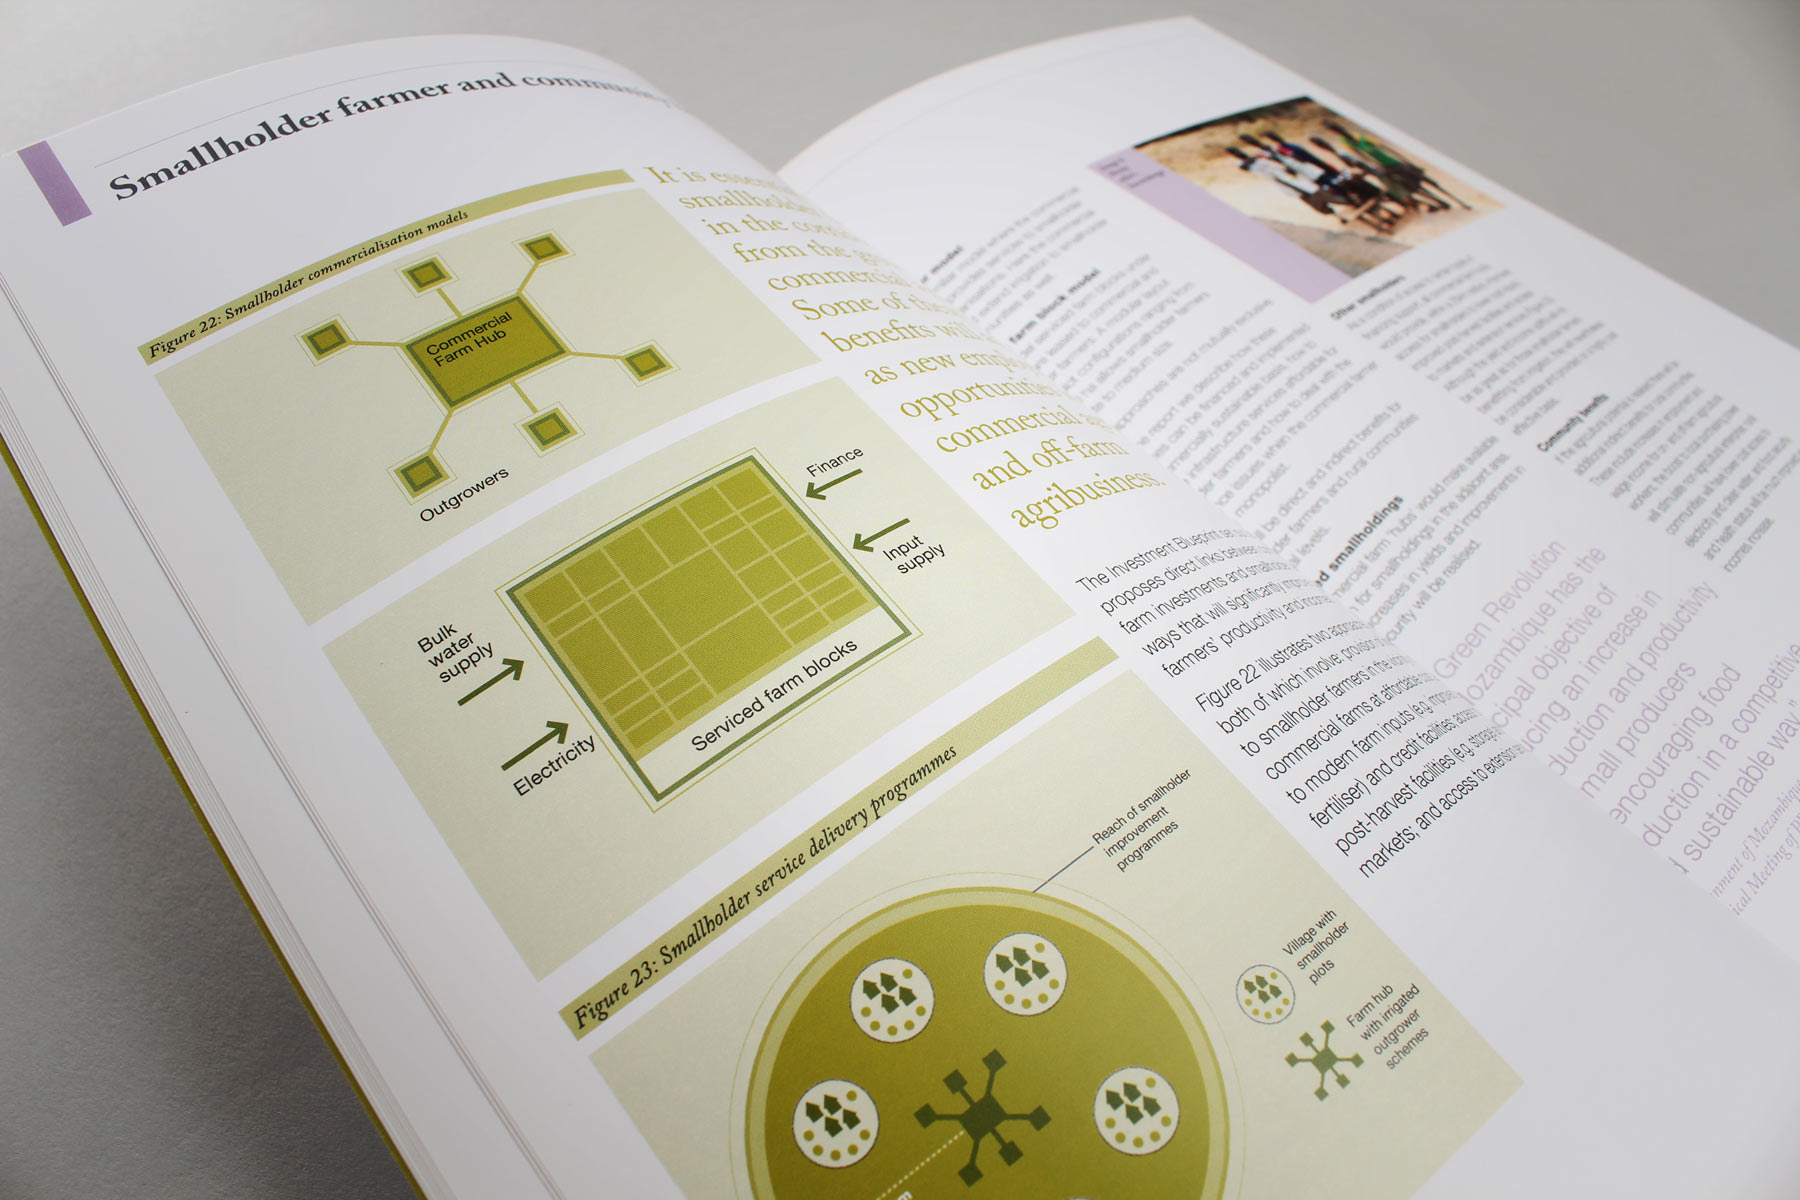
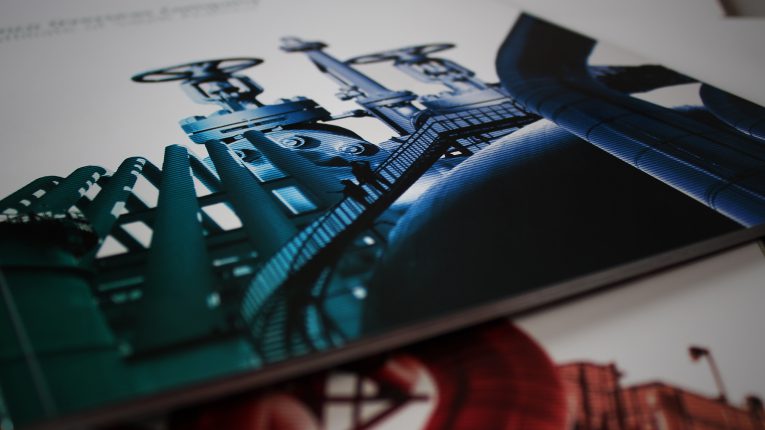
With the project supported by the private sector, universities, the Mozambique government and being presented with the intent of recruiting high-level support, ‘The Investment Blueprint’ needed a sleek professional feel to be produced in a tight time-frame. The report dealt with an area entitled The Beira Growth Corridor, which has a great potential for farming – but a potential that can only be realised through simultaneous investment in the necessary infrastructure and agricultural programs. Working closely with InfraCo, Firedog developed an understated visual language for the report – keeping the core message as the potent as possible. The typography was bold but elegant, they colour palette was deliberately muted and both were mixed with documentary photography from previous trips to the area. This pared down visual language was also applied to a large number of information-heavy diagrams and maps that provided detailed explanations of the plans, expressing the maximum data in the most concise and meaningful way.
The results
The publication was exceptionally well received at the World Forum and Infraco have managed to grow their project portfolio substantially from new partners in the process.
We selected a large amount of positive development imagery to underpin the narrative of the publication.